
Official website of…
Alex Shaw III
Hello folks! I am Alex Shaw III and enjoy designing and developing user-friendly tools, visually appealing presentations, shape objects, graphics and games.
I know how to do many things.
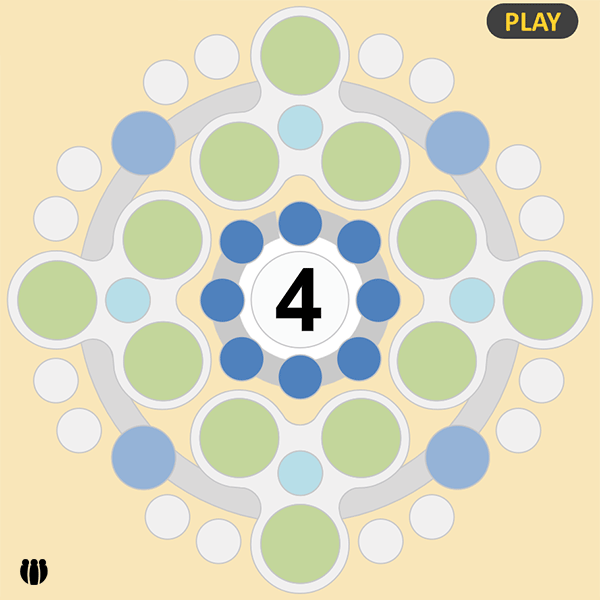
Bubble Dip Match
To play Bubble Dip Match, simply make matches through five levels with quick bonus rounds.
Learn more Play gameGames